- Published on
The 30-Second Tollgate: How a Gateway Killed a Service That Was Working Perfectly
- Authors

- Name
- Joel Thaduri
- @jaayydeetee
The 30-Second Tollgate: How a Gateway Killed a Service That Was Working Perfectly
POSTED ON JULY 12, 2026 TO Distributed Systems, Kubernetes, Production Engineering
By Joel
In distributed systems, the hardest bugs are rarely the ones where code is broken. They are the ones where every component behaves exactly as designed and the system still fails. We recently hit a failure in a GKE-hosted service where the service produced a correct response and the caller simultaneously logged an error. Both were telling the truth. Neither was wrong.
The root cause turned out to live in a layer of infrastructure that most application engineers never look at, and that no amount of re-reading application logs would ever surface. In this post, we walk through the debugging process, build up the Kubernetes request path from the container to the front door, and show why request deadlines are almost never owned by the code that appears to be failing.
A Bug That Made No Sense
One of our services was failing. Not crashing, but failing. The logs from the service itself were clean: it received the request, did its work, produced a well-formed response, and returned it. Every stage reported success.
And yet the caller, an orchestrator that had asked this service to do the work, logged an error and fell back to a generic failure message for the user.
How can a service return a correct answer and fail at the same time?
The timestamps gave it away:
11:00:39.148   caller sends request, service receives it
11:01:09.146   caller logs an ERROR          <- exactly 29.998s later
11:01:20.000   service finishes and returns its answer   (~40s total)
The caller gave up at almost exactly 30 seconds. The service needed roughly 40. Nobody's code contained a 30-second timeout. So who hung up the phone?
The answer is a piece of infrastructure that sits silently between every two services in a Kubernetes cluster, commonly called a gateway. Understanding it means understanding the entire stack of components Kubernetes places between a container running your code and a request arriving at it. Let's build that stack from the bottom up.
The Request Path Overview
Before the terminology, hold this picture in your head. A request traveling through Kubernetes is like a package moving through a delivery network. Each hop adds a layer of indirection, and each layer has its own rules.
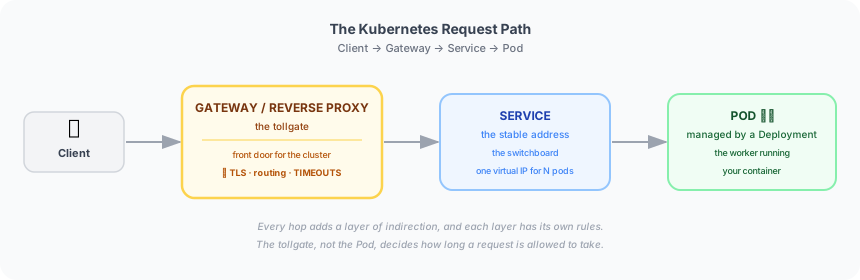
Figure 1: The layers a request passes through before reaching your code.
Every box in that diagram is a distinct Kubernetes concept, and our bug lived in the top one. Here is what each does.
Pods and Deployments: The Workers
A Pod is the smallest unit Kubernetes runs. It is one container, or a few tightly-coupled containers, sharing a network address and a lifecycle. Your application code runs inside a Pod. Pods are deliberately disposable: they are killed, rescheduled, and replaced constantly. A Pod that exists right now may be gone in five minutes, with a new one carrying a new IP address in its place.
That disposability is a feature, but it creates a problem. If Pods come and go with random IPs, how does anything reliably find your app?
Before we answer that, one layer up. You almost never create Pods by hand; you create a Deployment. A Deployment is a declarative spec that says, in effect, "I want two copies of this container image, with these environment variables and these resource limits, running at all times." Kubernetes then makes reality match that intent, spinning up Pods, replacing crashed ones, and rolling out new versions gracefully when the image changes.
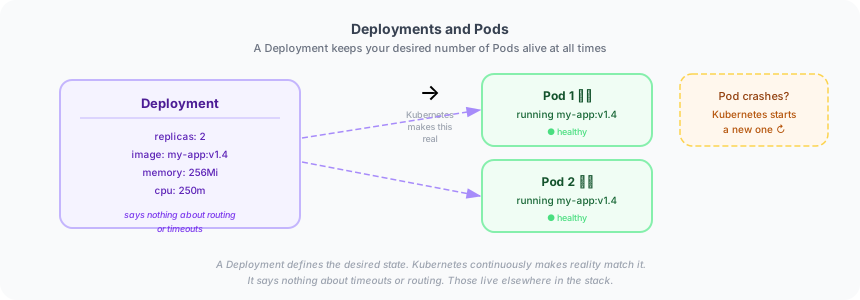
Figure 2: The Deployment describes the workers, and nothing about how traffic reaches them.
That last point is the crucial one for our bug: a Deployment says nothing about timeouts, routing, or gateways. We spent an hour re-reading the orchestrator's Deployment YAML looking for the 30-second limit. It was never going to be there. The Deployment defines the worker. The timeout lives in the plumbing in front of the worker.
Services: The Stable Address
Because Pods are disposable and their IPs churn, Kubernetes provides the Service: a single stable virtual IP and DNS name that always points at whatever Pods currently match a label selector. The Service load-balances requests across all healthy Pods behind it.
So instead of chasing Pod IPs, other apps talk to a fixed internal name:
http://context-agent.default.svc.cluster.local:8080
That name resolves only inside the cluster. It is the internal switchboard: dial the extension, and the Service connects you to a currently-working Pod. No gateway, no public internet, no tollgate. Remember this address, because it is the hero at the end of the story.
The most common Service type, ClusterIP, is internal only. Which raises the next question: if Services are internal, how does traffic from the outside world, or even from one service reaching another over a public URL, get in?
Proxy vs. Reverse Proxy: The Concept Everything Hinges On
Here is the distinction that makes the rest click.
A proxy, or forward proxy, sits in front of clients and represents them to the wider world. Think of a corporate network where all employee traffic exits through one gateway. The servers on the internet see the proxy, not the individual employees. It works on behalf of the client.
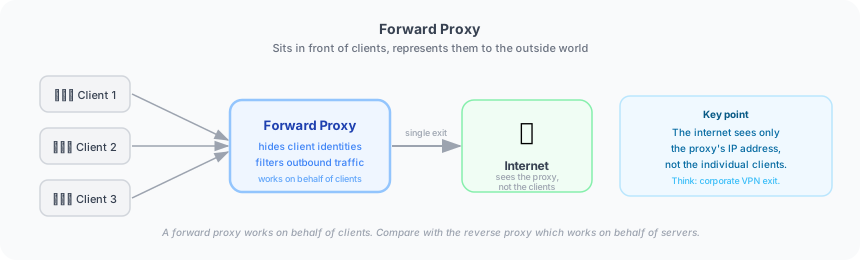
Figure 3: A forward proxy fronts clients.
A reverse proxy is the mirror image. It sits in front of servers and represents them to clients. The client believes it is talking directly to your app, but it is actually talking to the reverse proxy, which forwards the request to one of many backend servers behind it. It works on behalf of the server.
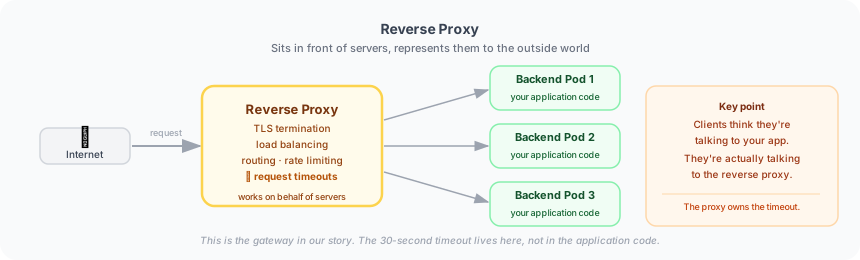
Figure 4: A reverse proxy fronts servers. The gateway in our story is exactly this, and it owns the timeout.
Reverse proxies are ubiquitous because that single chokepoint is an excellent place to centralize the unglamorous but critical work:
- TLS termination: handle HTTPS once, so the application does not have to.
- Routing: send
/apito one service and/imagesto another. - Load balancing: spread traffic across Pods.
- Rate limiting and auth: reject bad traffic before it reaches application code.
- Timeouts: decide how long a backend is allowed to take before the proxy gives up and returns an error to the client.
Read that last one again. The reverse proxy, not your application, owns the request deadline. That is the entire bug in one sentence.
Kubernetes runs reverse proxies at two levels. Inside the cluster, a component called kube-proxy runs on every node and implements Service routing at the network layer. It is what makes that stable virtual IP forward to real Pods. But the proxy that bit us operates a layer higher, at HTTP, and in Kubernetes that is the Ingress Controller.
Ingress, Ingress Controllers, and the Gateway: The Tollgate
An Ingress is a Kubernetes object that describes HTTP routing rules, for example, "requests for api.example.com/context-agent should go to the context-agent Service." But an Ingress object is only a rulebook. It does nothing on its own.
The component that reads that rulebook and actually moves packets is the Ingress Controller. This is a real, running reverse proxy, commonly NGINX (ingress-nginx) or a cloud load balancer provisioned by the platform. On GKE, that is a Google Cloud Load Balancer. It is the front door to the cluster.
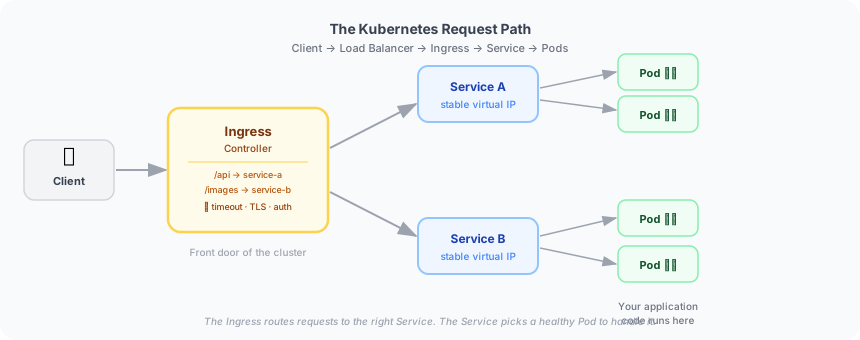
Figure 5: Ingress describes routing rules. The Ingress Controller enforces them, and owns the timeout.
Engineers often just call this the gateway, and it is the right word. It behaves like a tollgate on a highway. Every request entering the cluster, or in many setups moving between services over public URLs, passes through it, and it enforces the house rules. One of those rules is a response timeout: a hard limit on how long a backend may take before the gateway declares the request dead, returns a 504 Gateway Timeout to the caller, and closes the connection.
The common defaults are telling:
- Google Cloud Load Balancer backend service:
timeoutSecdefaults to 30 seconds. - ingress-nginx:
proxy-read-timeoutdefaults to 60 seconds. But if a cloud load balancer sits in front of NGINX, which is very common, the outer 30-second cap wins.
One naming note, because it trips people up. Two things share the name "gateway." There is the informal sense above, the reverse proxy that fronts the cluster. And there is the newer Gateway API, a Kubernetes standard with Gateway and HTTPRoute objects that is gradually replacing Ingress with a more expressive, role-oriented model. When a platform engineer says "the gateway has a 30-second timeout," they mean the tollgate, regardless of which API configures it.
Back to the Bug
With that stack in view, the impossible bug becomes ordinary.
Our orchestrator did not call the context-agent over the internal svc.cluster.local address. It called the public URL, https://api.example.com/context-agent, which meant the request left the cluster, hit the gateway, and came back in. The gateway's backend timeout was the default 30 seconds.
The context-agent legitimately needed roughly 40 seconds for this particular request: a large language-model call plus a citation-verification pass. So the sequence was:
- The orchestrator sends the request. It passes through the gateway to the agent.
- The agent starts working. Twenty seconds pass. Twenty-five. Twenty-nine.
- At 30 seconds, the gateway's patience runs out. It returns a 504 to the orchestrator and tears down the connection.
- The orchestrator's HTTP call fails. It catches the error, logs it, and shows the user a fallback message.
- At 40 seconds, the agent, unaware that nobody is listening anymore, finishes its correct answer and writes it into a closed connection.
sequenceDiagram
    participant O as Orchestrator
    participant G as Gateway (30s timeout)
    participant A as context-agent
    O->>G: POST /context-agent  (t=0s)
    G->>A: forward request
    Note over A: LLM call + citation pass
    G--xO: 504 Gateway Timeout  (t=30s)
    Note over G,A: connection torn down
    A--xG: 200 OK, correct answer  (t=40s)
    Note over A: writes into a closed socket
Figure 6: The service was never broken. The tollgate closed before the worker finished the job.
Every log we trusted was telling the truth. We were reading them from inside the toll booth's blind spot.
The Fixes, in Order of How Much They Actually Solve
Raise the gateway's timeout. This is the quick mitigation. Bump the backend response timeout for that route from 30s to something like 90s. On GKE that is timeoutSec on the BackendConfig attached to the Service. On ingress-nginx it is the proxy-read-timeout annotation. This is a band-aid. If the service gets slower, you will hit the new ceiling too.
Skip the gateway entirely for internal calls. This is the real fix. There was no reason for one in-cluster service to phone another over the public internet and its tollgate. Calling the internal Service address, http://context-agent.default.svc.cluster.local:8080, keeps the traffic inside the cluster, where no 30-second gateway timeout applies. It is faster, cheaper, and more private.
Own your own deadline. This is the discipline fix. The caller was making an HTTP request with no client-side timeout at all, which is how it ended up at the mercy of whatever the gateway decided. Set an explicit timeout in your own code so that you control the failure mode, and it happens predictably rather than depending on infrastructure you may not know is in the path.
Key Takeaways
In Kubernetes, code runs in Pods, managed by Deployments. Pods are reached through Services, which give them a stable internal address. Traffic from outside, or between services over public URLs, enters through a reverse proxy commonly called the gateway, and that gateway, not the application, decides how long a request is allowed to take.
So when a service that clearly works still fails, do not stop at the service's logs and its Deployment YAML. Walk the entire request path and check the tollgate. Ours had a 30-second rule we never knew existed.
Debugging distributed systems is rarely about finding broken code. It is about finding the one layer you forgot was in the path.